3.1.2Why tangents?

Secants to Tangents, AROC to IROC


3-19.

For which of the functions below can we apply the Power Rule from problem 3-5?

  1.  y=1x

  1. y=x5

  1. y=x

  1. y=2x

  1. y=4x0

3-20.

Use the results from problems 3-5, 3-7, and 3-8 to write an equation for g(x) for each function below.  

  1. g(x)=2x3

  1. g(x)=x8x2

  1. g(x)=4x32x+5

  1. g(x)=6(x+2)4

  1. g(x)=(x+7)1012x5

  1. g(x)=2(x3)3+4(x+l)2

3-21.

In Chapter 1, you discovered that for any function f, the slope of a secant line at x=a, f(x)f(a)xa, can be used to determine the average rate of change (AROC) over an interval. For example, average velocity, Δ distanceΔ time, represents average rate of change. Today you will investigate the meaning of the slope of a tangent line at a point of tangency on a curve. Before you begin, think back to your study of geometry. How is a tangent line different from a secant line?

3-22.

A ladybug travels along a straight line at a distance of 10t2 millimeters in the first t seconds after it starts.

  1. Sketch a graph of the bug’s position as a function of time.

  2. Sketch secant lines over the intervals below. Label these secant lines with their slopes, i.e. average velocity / average rate of change (AROC).   

    1. [3,4]

    1. [3,3.1]

    1. [3,3.01]

3-23.

We want to generalize the procedure you used in the last problem to any function over any interval. We will begin by computing the average velocity of our ladybug (d(t)=10t2) from t=3 to t=3+h. As always, compute the average velocity by dividing the change in distance (Δd) by the change in time (Δt).

  1. What is the change in time over the specified interval?    

  2. Show that the change in distance over this time interval is 60h+10h2.

  3. What is the average velocity over this time interval?

First quadrant, x axis labeled time, seconds, with 2 tick marks labeled 3, & 3 + h, y axis labeled distance, mm, increasing upward curve, from origin to top right, 2 highlighted points @ (3, 90), & @ (3 + h, comma 10 times the squared quantity of 3 + h, with slope triangle between the 2 points, horizontal leg labeled, 3 + h minus 3, vertical leg labeled, 10 times the squared quantity of 3 + h minus 90.

3-24.

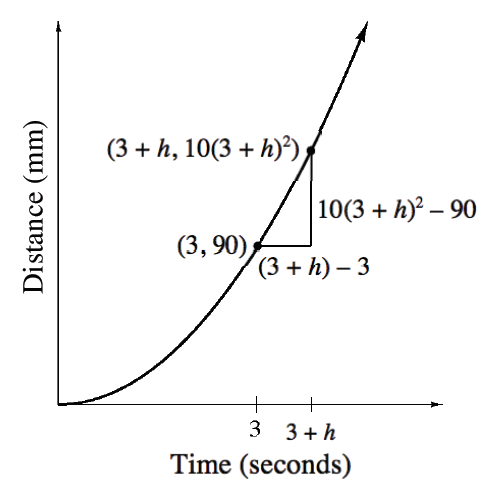
In the previous problem you approximated the ladybug’s velocity at t=3 by calculating the slope of the secant line between t=3 and t=3+h.

  1. What will the line look like if h approaches 0? With your team, make a prediction about the slope of this line. Justify your prediction.

  2. Throughout this course we have used the slope of the secant line to calculate the average rate of change, as in the Ramp Lab. What will the slope of the tangent line calculate?  

3-25.

Suppose s(t) represents the distance a cockroach has traveled as a function of time t. We know that the slope of the secant line of the graph represents the average velocity of the cockroach.

  1. Describe how the instantaneous velocity (IROC) can be represented on a distance graph?  

  2. Use the preceding Math Notes box to write an expression to describe the instantaneous velocity of the cockroach at t=12 seconds.

3-26.

Examine the graphs below. Some are slope functions of others. For each graph, determine whether one of the remaining graphs can be its slope function. If its slope function is not one of the options, sketch what it will look like.  

  1. Horizontal line passing through the point (0, comma negative 2).

  1. Increasing cubic curve, changing from opening down to opening up at (0, comma negative 2)

  1. Decreasing line, passing through the origin, & the point negative 1, comma 2).

  1. Upward parabola, vertex at the point (0, comma negative 1).

  1. Downward parabola, vertex at the point (0, comma 1).

3-27.

If f(15)=3 and f(20)=4, must f have a root between x=15 and x=20? Explain why or why not. Be sure to include sketches that support your reasoning. Homework Help ✎

3-28.

Write slope functions for the following functions: Homework Help ✎

  1. f(x)=7x2

  1. f(x)=π2 (Careful!)

  1. f(x)=2(x2)4+18x

  1. f(x)=13x6+2x43

3-29.

Is the function graphed below continuous at the following values of x? If not, explain which conditions of continuity fail. Homework Help ✎

x=4,3,0, and 2

Piecewise, left curve coming from left below, x axis, falling to approximate point (negative 4, comma negative 3), rising to open point (negative 3, comma negative 2), then falling to negative infinity, left of y axis, right curve coming from negative infinity, right of y axis, increasing opening down to closed point (2, comma negative 1, ray starting at open point (2, comma 0), continuing up & right, & closed point at (negative 3, comma 1).

3-30.

For the graph in problem 3-29, state the domain and range using interval notation. Homework Help ✎

3-31.

Evaluate the following limits. Homework Help ✎

  1. limx4(3x2)

  1. limx3+(62x)

  1. limx(x)

  1. limx(1x2)

3-32.

Jasmin rolled a ball down a very steep ramp and got the distance function s(t)=2.3t2, where t is measured in seconds and s(t) is measured in feet. Sketch a graph of her distance function on your paper. Then, carefully approximate the speed of the ball at t=3 seconds. 3-32 HW eTool (Desmos). Homework Help ✎

3-33.

Expand and evaluate the following sums. Homework Help ✎

  1. i=26(3i)

  1. i=110(5+12i)

3-34.

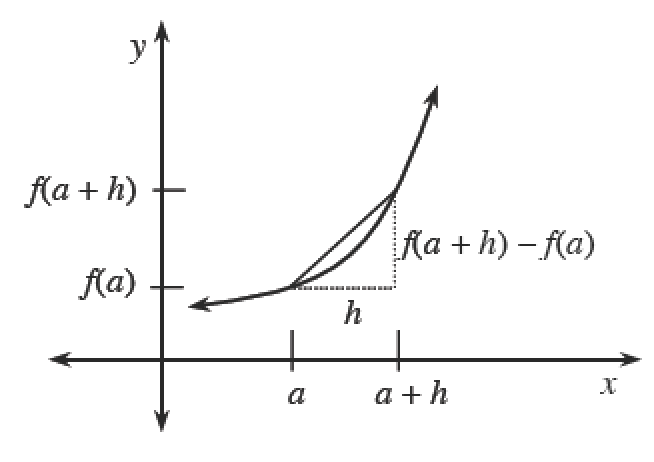
In many textbooks the derivative (or IROC) is described in terms of x and Δx (delta x) instead of x and hHomework Help ✎

  1. Explain why h and Δx are equivalent.

  2. Use the diagram at right and the definition of IROC to write the slope of the tangent line in terms of x and Δx.

Downward parabola, with x axis enclosing the parabola on the bottom side, with 2 dashed vertical lines between curve & x axis, labeled, x, &, x + delta x, with 2 increasing lines, one labeled, slope = f prime of x, tangent to the curve at dashed line, x, & other passing through the 2 points at the top of the 2 dashed lines.